Quick Answer: A WiFi heatmap shows how wireless signal behaves across a space, and many business networks are built without that level of visibility. The result is often uneven coverage, interference, and performance problems that only become obvious during day-to-day use.
Why Business WiFi Feels Unreliable (Even When Signal Looks Strong)
Most business WiFi problems are not constant. They show up as inconsistency. One area works fine, another drops calls, and another slows down during busy periods.
Devices may show full signal, but performance still falls off. In many cases, that points to a design problem rather than a hardware failure.
A common mistake is placing access points based on layout convenience instead of how signal actually travels through the space. That can seem fine at first, then break down as more users and devices connect.
Without visibility into signal behavior, decisions are based on assumptions. Over time, those assumptions can lead to coverage gaps, interference, and unstable performance.
What Is a WiFi Heatmap?
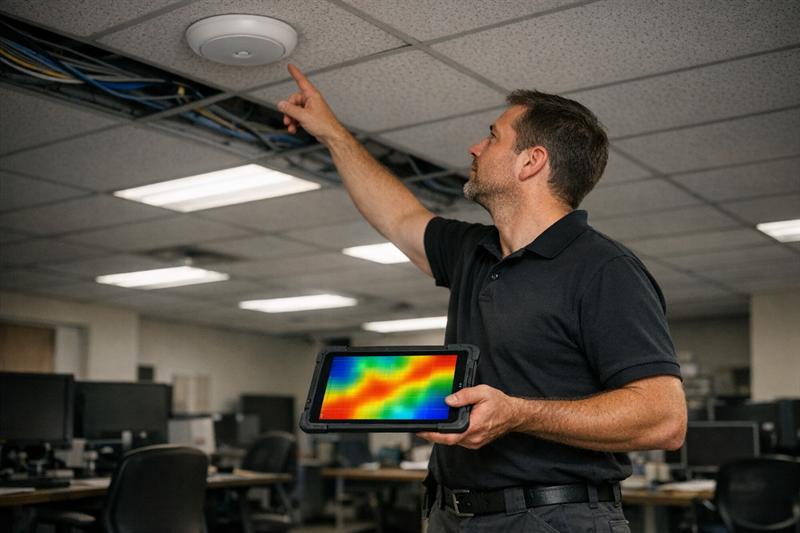
A WiFi heatmap is a visual representation of wireless signal strength across a physical space. It maps signal data onto a floor plan, showing where coverage is strong, weak, or inconsistent.
It is typically created during wireless site surveys, where signal behavior is measured or modeled across the environment.
How a Heatmap Visualizes Signal Strength
Heatmaps use color gradients to represent signal quality. Strong coverage areas often appear in green, moderate areas in yellow, and weaker zones in red.
This makes it easier to see how signal moves through offices, warehouses, and multi-floor buildings. It also shows how walls, glass, and equipment can affect coverage.
What Data a Heatmap Captures
A heatmap is based on RF data that reflects how the network behaves in real conditions. This typically includes:
- RSSI, which indicates signal strength
- SNR, which reflects signal quality compared to background noise
- Interference from nearby devices or networks
- Channel overlap between access points
This is where many networks fall short. Coverage may look acceptable, but signal quality and interference often explain why performance feels inconsistent.
Why WiFi Heatmaps Matter for Businesses
WiFi heatmaps connect signal behavior to real operational impact. When signal is uneven, users experience dropped calls, slow applications, and unreliable connections.
Coverage vs Performance: The Critical Difference
Coverage means a device can connect. Performance means that connection remains stable under load.
This distinction is often overlooked. A network can show full coverage and still struggle when multiple users connect at once. That usually points to a capacity issue, not just a coverage issue.
For a deeper look at how capacity affects performance, see WiFi capacity planning for business environments.
This tends to become more noticeable as device counts grow. Networks that seem stable at low usage can slow down or drop connections as demand increases.
Hidden Issues Heatmaps Reveal
Heatmaps make it easier to identify problems that are not obvious during installation:
- Dead zones in high-use areas
- Interference from building materials or nearby networks
- Overlapping access points that compete on the same channels
- Roaming gaps between coverage areas
In troubleshooting, these issues often do not show up clearly on paper. The network may look complete, while users still experience gaps and instability that require deeper analysis.
If your network feels inconsistent, this is where to look:
- Users report strong signal but slow performance
- Issues appear during peak usage times
- Specific rooms or zones consistently underperform
- Access points have been added over time without a clear plan
These patterns often point to a design issue. A structured heatmap and site survey can help identify the cause before more hardware is added.
Types of Wireless Heatmaps
Different types of heatmaps are used depending on whether the network is being planned or evaluated.
Predictive Heatmaps (Planning Phase)
Predictive heatmaps model signal behavior before installation. They use floor plans, materials, and expected usage to estimate coverage.
This approach is commonly used for new offices or major redesigns. It helps guide access point placement before cabling and hardware are installed.
Passive Surveys
Passive surveys measure existing signal without generating additional traffic. They help identify coverage gaps and interference patterns.
This is often the starting point when diagnosing performance issues.
Active Surveys
Active surveys test the network under real usage conditions by generating traffic. This shows how the network performs when users are actively connected.
This is often where deeper issues appear. A network that looks stable during passive measurement may still struggle under load.
What Happens Without a WiFi Heatmap
Without a heatmap, network design often relies on trial and error. Access points are placed based on layout instead of measured signal behavior.
Common Problems Businesses Experience
- Dead zones in critical work areas
- Overlapping signals that create interference
- Slow performance during high usage
- Repeated troubleshooting without a clear fix
A common outcome is adding more access points to fix coverage gaps, only to create more interference and less predictable performance.
The Cost of Reactive vs Planned Infrastructure
Reactive fixes often lead to repeated adjustments. Equipment may be moved, configurations changed, and cabling modified more than once.
Over time, this increases costs and disrupts operations. It can also make future scaling more difficult.
Planning infrastructure correctly from the start, including cabling, plays an important role in wireless performance. See structured cabling design best practices for how physical design supports network stability.
How Heatmaps Fit Into a Professional Wireless Site Survey
Heatmaps are part of a structured process used to design and validate wireless networks. They work alongside on-site measurements and planning decisions.
Tools and Methodology Used by Professionals
Professional surveys use RF tools to collect signal data across multiple locations. Floor plans are calibrated, and measurements are taken throughout the space.
This approach replaces assumptions with measurable data and provides a clearer picture of how the network behaves.
How Results Guide Infrastructure Decisions
Heatmap data is used to guide key decisions, including:
- Where access points should be placed
- How channels should be configured
- Where cabling and switching equipment should be installed
- How the network can scale over time
This is where planning becomes practical. Decisions are based on actual conditions, which helps reduce rework later.
When a Business Should Invest in a WiFi Heatmap
New Office or Facility Buildouts
Planning before installation helps avoid repositioning equipment later. This is one of the most effective times to use predictive heatmaps.
Ongoing Performance Issues
If issues are recurring or inconsistent, the root cause is often tied to design. A heatmap helps show what is happening across the space instead of relying on guesswork.
Scaling or Adding Devices
As more devices connect, networks that once worked well can begin to slow down. This is often when capacity limits become visible.
Renovations or Layout Changes
Changes to walls, materials, or layout affect how signal moves. Even small changes can create new weak areas or interference.
Key Takeaways
- WiFi heatmaps show how signal behaves across a space
- Strong signal does not guarantee stable performance
- Many WiFi issues are tied to design decisions, not just hardware
- Heatmaps help identify interference, congestion, and coverage gaps
- They support networks that perform more consistently as demand grows
Conclusion
Many business WiFi issues trace back to how the network was designed. Without visibility into signal behavior, problems can build over time and become harder to resolve.
As usage increases, these issues usually become more noticeable. Performance drops, troubleshooting becomes ongoing, and quick fixes stop working.
Ascio Wireless, LLC approaches this by focusing on how networks perform over time, not just at installation. Heatmaps and structured site surveys help guide decisions early, reducing rework and supporting long-term reliability.
If the network is inconsistent or struggling under load, the next step is to understand how signal behaves across the space before adding more hardware.
Frequently Asked Questions
What does a WiFi heatmap show?
A WiFi heatmap shows signal strength, coverage, and interference across a physical space. It uses RF data such as RSSI and signal quality to highlight strong and weak areas. This helps pinpoint where performance issues may be occurring.
How is a wireless heatmap created?
A wireless heatmap is created using software tools along with on-site measurements or predictive modeling. Signal data is collected across multiple points or estimated based on building layouts. A structured survey generally improves accuracy.
Do small businesses need WiFi heatmaps?
In many cases, yes. Even smaller environments can experience interference and performance issues as device usage increases. A heatmap helps support a network design that fits current needs and future growth.
What is the difference between a heatmap and a site survey?
A heatmap is the visual output, while a site survey is the broader process used to collect and analyze network data. The survey includes measurements, testing, and planning decisions that inform the final design.
How accurate are predictive WiFi heatmaps?
Predictive heatmaps are useful for planning, especially when combined with real-world measurements. Environmental factors such as building materials and interference can affect accuracy.
How often should a business update a WiFi heatmap?
A heatmap should usually be updated after significant changes such as renovations, new equipment, or increased device usage. These changes can affect signal behavior and introduce new performance issues.